While searching for a solution to visualize the data I'm processing with my Workout tools I've been searching for an existing solution, but none fit my needs.
I was looking for something that
- generates static images. Several formats (jpg, png, svg, ...) are desirable.
- is usable within a web environment. So it must allow writing the data to STDOUT and not only to a file.
- is usable as backend for a GTK widget. It must be quite fast to cope with resizes, zooms, ... and have the hooks for mouse feedback.
- mixed lines, area and bar graphs
- at least 5 independent y-scales (elevation, speed, heartrate, power, cadence)
- allows numeric x-axis and dynamic axis label formating
- is extensible
None of the the solutions I've looked at did this.
For now I've just hacked up "something" that meets the most important needs. So there's still a lot missing and I expect quite a bit of change when the gaps are filled.
MyChart uses Cairo as drawing backend allowing it to support plenty output options including Gtk. For Gtk Support there's a prebuilt Widget.
Screenshots
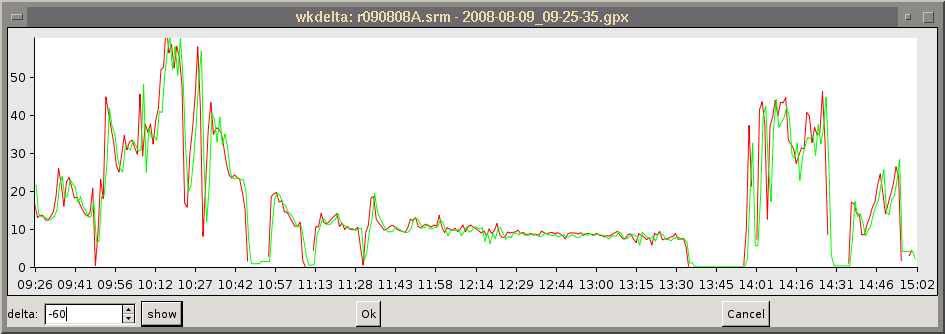
Speed plot of concurrent SRM (red) and GPS (green) recording for getting the time of both files in sync. This allows adding elevation info to my SRM data:

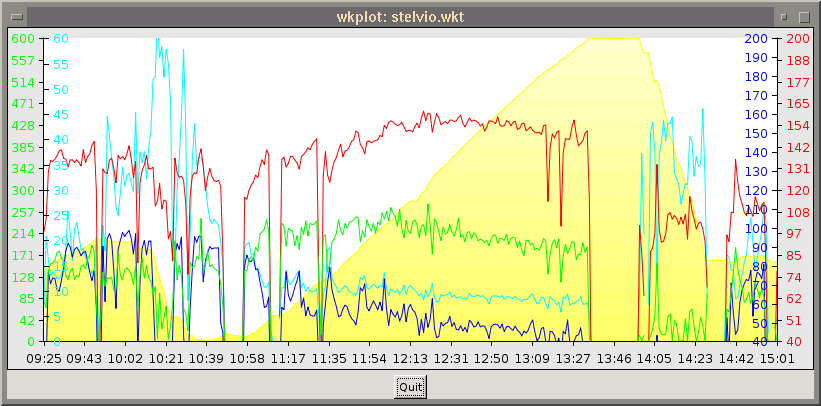
Merged Workout:

Changes:
0.03 2009-07-23
- MyChart now emits a signal when it needs a redraw
- MyChart::Gtk now accepts a pre-build chart as property
- added dependencies to Makefile.PL
- MyChart::Source checks for data bounds automagically
0.02 2009-04-23
- first public release